
Click below for a full screen walkthrough video.
▶️ Analyzing a Baseline Campaign
This walkthrough demonstrates how to analyze a completed security awareness phishing campaign. Users learn to navigate the campaign dashboard, interpret key metrics like click rates and user engagement, review which phishing email themes were most effective, and drill down into individual user behavior. The outcome is a comprehensive understanding of baseline security risk and the ability to identify high-risk users for targeted follow-up training.
1. Login in to the CyberNut Admin Portal at http://admin.cybernut.com
2. Head to Campaigns — this is your central hub for tracking all security awareness activity across your organization.
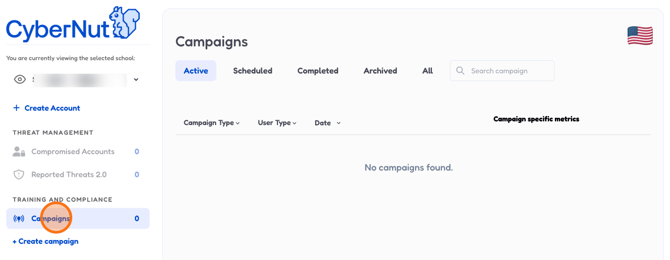
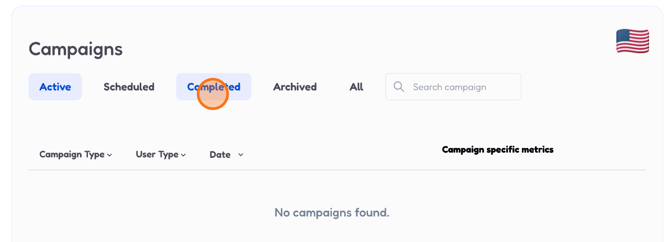
3. Click the Completed tab to filter down to campaigns that have already run their course and have results ready to review.
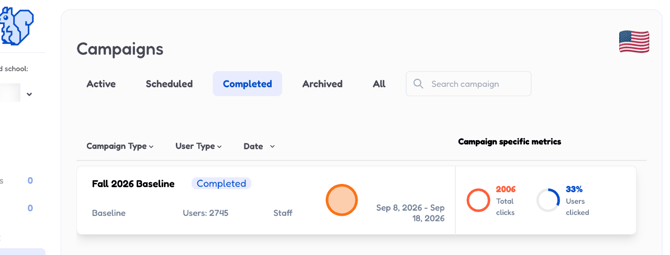
4. Select the Fall 2026 Baseline campaign — this is the one we'll be walking through in detail.
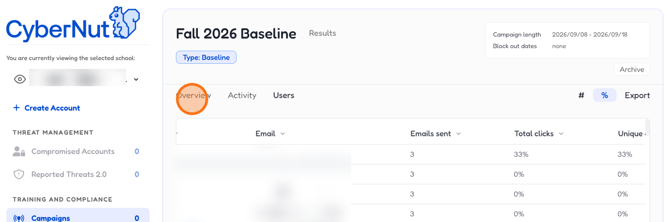
5. Take a moment here — this overview gives you a snapshot of all key campaign metrics in one place before we dive deeper.
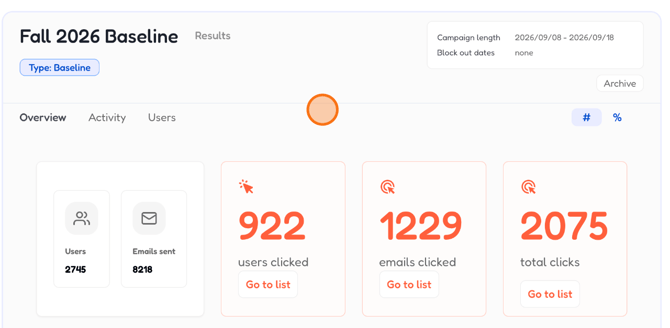
6. Click the % toggle to switch from raw numbers to percentages, making it easier to benchmark and compare results.
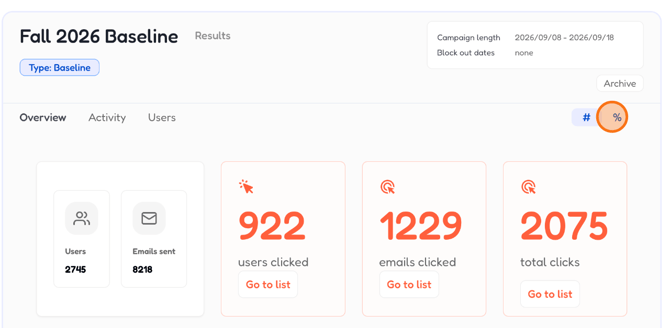
7. This shows the total number of users assigned to the campaign — your starting point for understanding scope and coverage.

8. This is the total emails sent — since each user receives 3, divide by 3 to confirm your user count lines up.

9. This click rate tells you what share of users engaged with at least one phishing email — a key indicator of baseline risk.
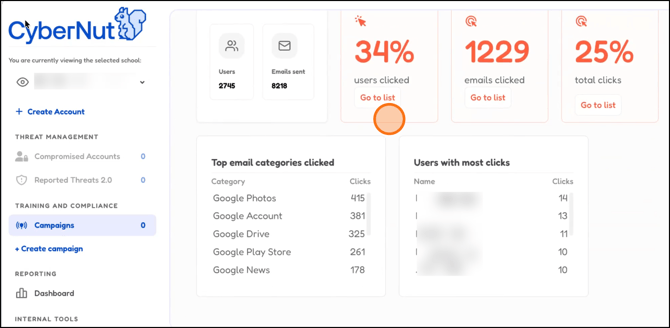
10. Unique clicks remove duplicates, so you get a cleaner picture of how many distinct emails actually caught users' attention.
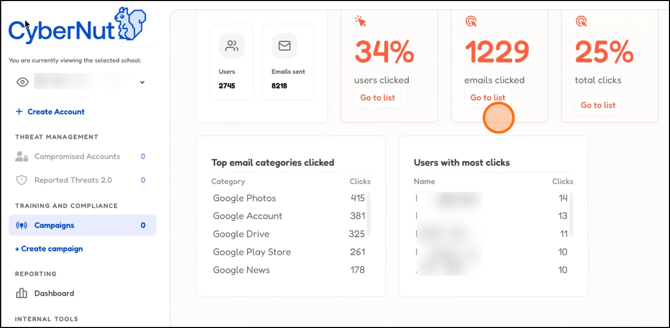
11. This ratio shows overall click volume relative to total emails sent — useful for spotting whether certain sends drove disproportionate engagement.
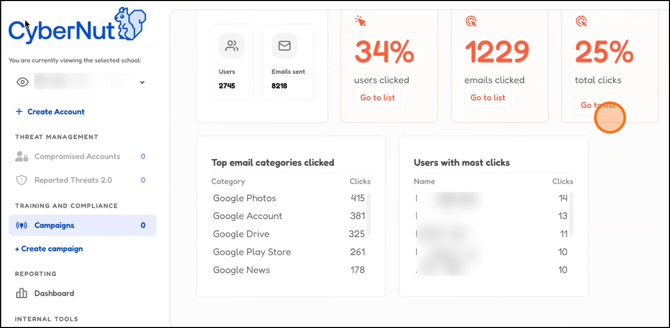
12. Scan these top email categories to understand which phishing themes landed most effectively — use this to shape your next training focus.
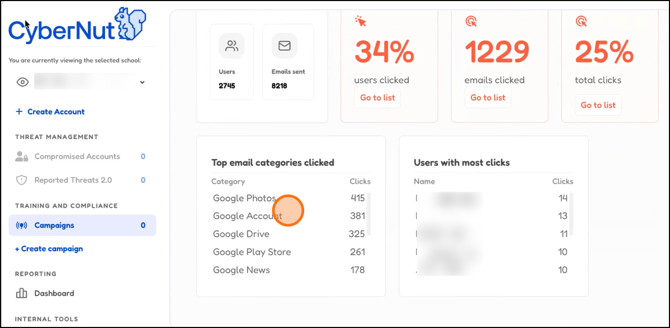
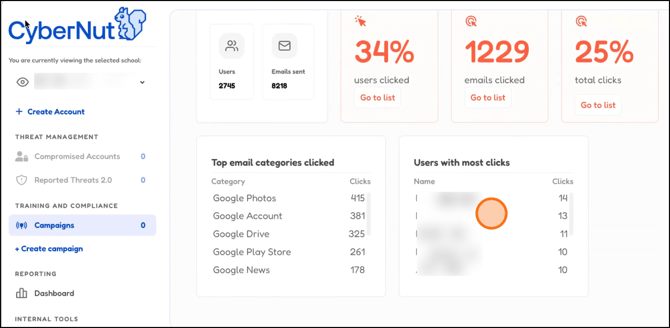
13. These are your highest-risk users based on click behavior — a great starting point for targeted follow-up or additional training.
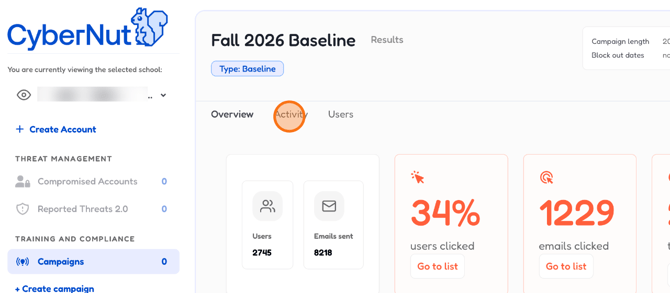
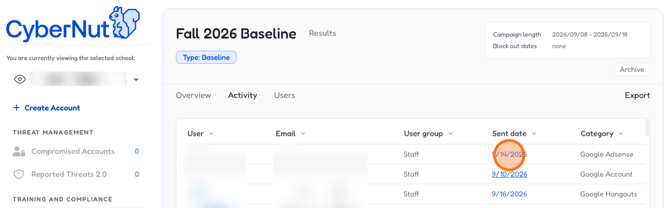
14. Switch to the Activity tab to see a chronological timeline of exactly when and how users interacted with campaign emails.
15. Click on a specific date to pull up the exact email that triggered the interaction — handy for connecting behavior to content.
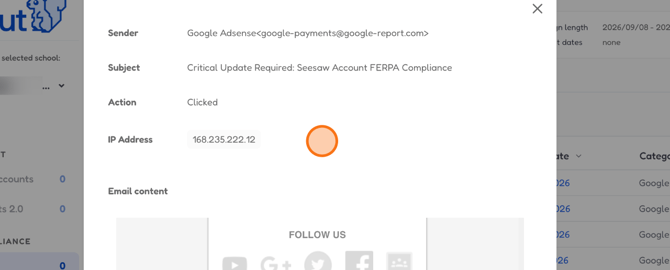
16. Preview the email here to see exactly what the user saw — context that helps explain why they may have clicked.
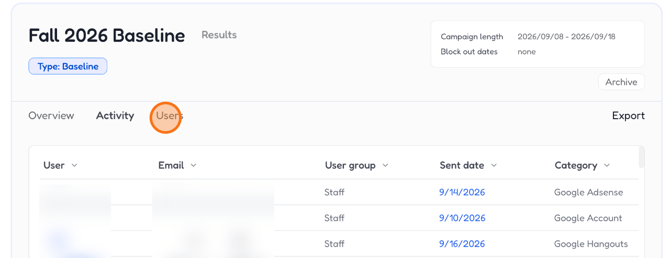
17. Head to the Users tab to break down results by individual — spot patterns and identify who needs the most support.
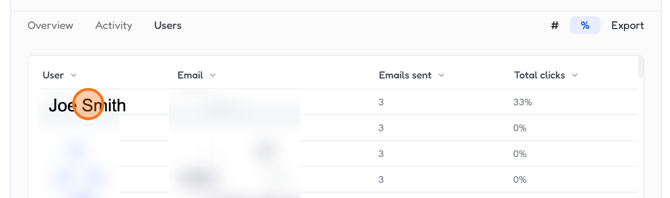
18. Click on a user to drill into their specific interactions — including which emails they received and how they responded.
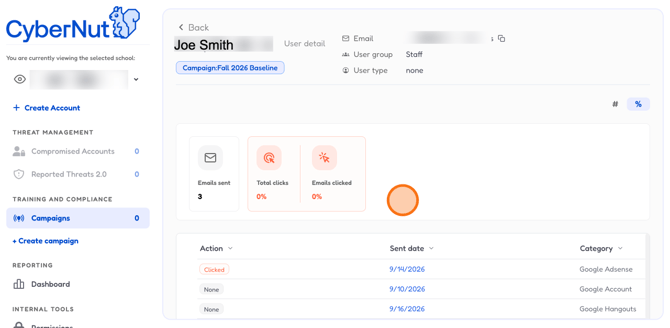
19. Here you'll see a full breakdown of this user's activity — clicks, timing, and which emails they engaged with during the campaign.
20. Return to the Overview tab to bring it all together — a high-level summary to anchor your campaign debrief or reporting.
21. Congratulations!
You now know how to read and navigate a completed baseline campaign — from top-line metrics to individual user activity.